Instant Reaction: Housing Starts, May 18, 2021


“Today’s data, showing a decline in housing starts in April, is discouraging at first glance. America is facing an epic housing shortage and more homes need to be built. The monthly data can be volatile, but the overall underlying trend is still on the upside. The year-to-date figures in 2021 for housing starts were 1.59 million units (annualized pace) compared to 1.38 million in 2020, a 15% gain. More importantly, single-family housing starts also declined in the latest month but were up 26% on a year-to-date basis.

More housing inventory will reach the market in a few months, certainly by autumn, because of the upward trend in home construction. In addition, the mortgage forbearance program will also steadily wind down, leading to further inventory. Moreover, the progress in vaccination among elderly homeowners will lead to normal life activity, including home sales that had been postponed since the onset of the pandemic.

Housing starts are projected to reach 1.6 million for all of 2021 and rise further to 1.7 million in 2022. This would mark the highest home construction activity in 15 years. It is not an overproduction, but rather an attempt to compensate for multiple years of underproduction that led to the current housing shortage.”

Lawrence Yun

Chief Economist and Senior Vice President, Research Lawrence Yun is Chief Economist and Senior Vice President of Research for the National Association of REALTORS®.

The year-to-date figures in 2021 for housing starts were 1.59 million units (annualized pace) compared to 1.38 million in 2020, a 15% gain.

Source: Instant Reaction: Housing Starts, May 18, 2021


Are We Headed For A Housing Crash? Is The Market Heading Into A Housing Bubble?

Experts Say Home Prices Will Continue to Appreciate

Experts Say Home Prices Will Continue to Appreciate | MyKCM

It’s clear that consumers are concerned about how quickly home values are rising. Many people fear the speed of appreciation may lead to a crash in prices later this year. In fact, Google reports that the search for “When is the housing market going to crash?” has actually spiked 2450% over the past month.

In addition, Jim Dalrymple II of Inman News notes:

“One of the most noteworthy things that came up in Inman’s conversations with agents was that every single one said they’ve had conversations with clients about whether or not the market is heading into a bubble.”

To alleviate some of these concerns, let’s look at what several financial analysts are saying about the current residential real estate market. Within the last thirty days, four of the major financial services giants came to the same conclusion: the housing market is strong, and price appreciation will continue. Here are their statements on the issue:

Goldman Sachs’ Research Note on Housing:

“Strong demand for housing looks sustainable. Even before the pandemic, demographic tailwinds and historically-low mortgage rates had pushed demand to high levels. … consumer surveys indicate that household buying intentions are now the highest in 20 years. … As a result, the model projects double-digit price gains both this year and next.”

Joe Seydl, Senior Markets EconomistJ.P.Morgan:

“Homebuyers—interest rates are still historically low, though they are inching up. Housing prices have spiked during the last six-to-nine months, but we don’t expect them to fall soon, and we believe they are more likely to keep rising. If you are looking to purchase a new home, conditions now may be better than 12 months hence.”

Morgan Stanley, Thoughts on the Market Podcast:

“Unlike 15 years ago, the euphoria in today’s home prices comes down to the simple logic of supply and demand. And we at Morgan Stanley conclude that this time the sector is on a sustainably, sturdy foundation . . . . This robust demand and highly challenged supply, along with tight mortgage lending standards, may continue to bode well for home prices. Higher interest rates and post pandemic moves could likely slow the pace of appreciation, but the upward trajectory remains very much on course.”

Merrill Lynch’s Capital Market Outlook:

“There are reasons to believe that this is likely to be an unusually long and strong housing expansion. Demand is very strong because the biggest demographic cohort in history is moving through the household-formation and peak home-buying stages of its life cycle. Coronavirus-related preference changes have also sharply boosted home buying demand. At the same time, supply is unusually tight, with available homes for sale at record-low levels. Double-digit price gains are rationing the supply.”

Bottom Line

If you’re concerned about making the decision to buy or sell right now, let’s connect to discuss what’s happening in our local market.


What’s Driving The Sellers Advantage? An Opportunity For Homeowners Who Are Ready To Move This Season.

3 Graphs Showing Why You Should Sell Your House Now

3 Graphs Showing Why You Should Sell Your House Now | MyKCM

There’s no doubt that 2021 is the year of the seller when it comes to the housing market. If you’re a homeowner thinking of moving to better suit your changing needs, now is the perfect time to do so. Low mortgage rates are in your favor when you’re ready to purchase your dream home, and high buyer demand may give you the leverage you need to negotiate the best contract terms on the sale of your house. Here’s a look at what’s driving this sellers’ advantage and why there’s so much opportunity for homeowners who are ready to move this season.

1. Historically Low Inventory

The National Association of Realtors (NAR) explains:

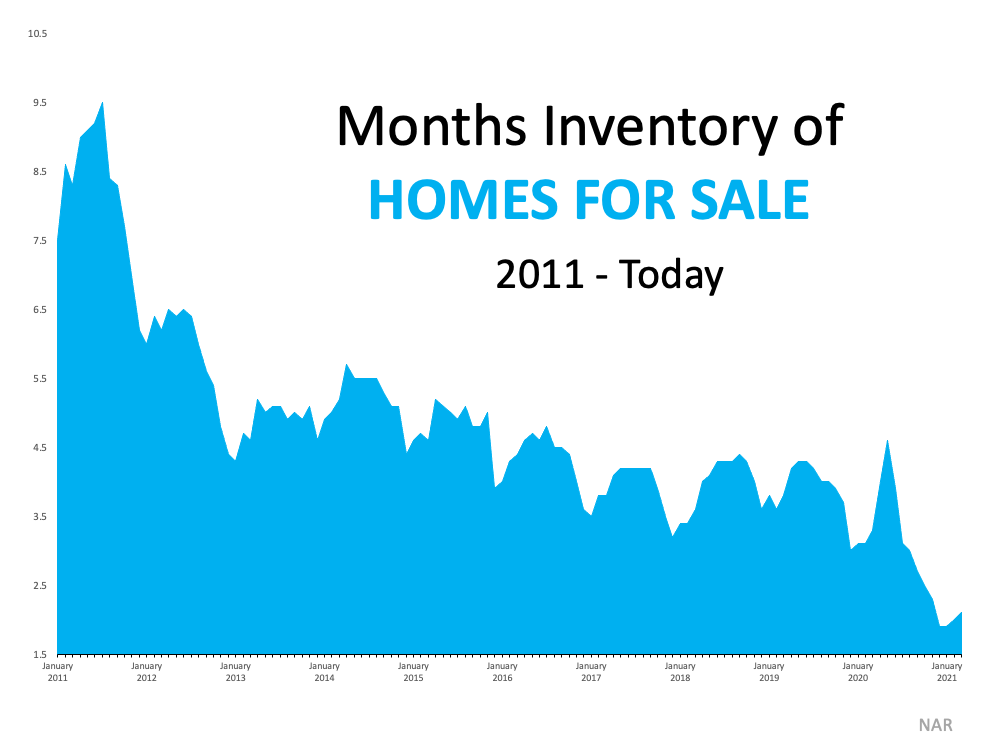
 “Total housing inventory at the end of March amounted to 1.07 million units, up 3.9% from February’s inventory . . . Unsold inventory sits at a 2.1-month supply at the current sales pace, marginally up from February’s 2.0-month supply and down from the 3.3-month supply recorded in March 2020.”

3 Graphs Showing Why You Should Sell Your House Now | MyKCM

Even with a slight rise in the number of houses for sale this spring, inventory remains near an all-time low (See graph below):High buyer interest is creating a major imbalance between supply and demand, but as the small uptick in inventory shows, sellers are beginning to reenter the market. Selling your house now enables you to take advantage of buyer demand and get the most attention for your house – before more listings come to the market later this year.

2. Frequent Bidding Wars

3 Graphs Showing Why You Should Sell Your House Now | MyKCM

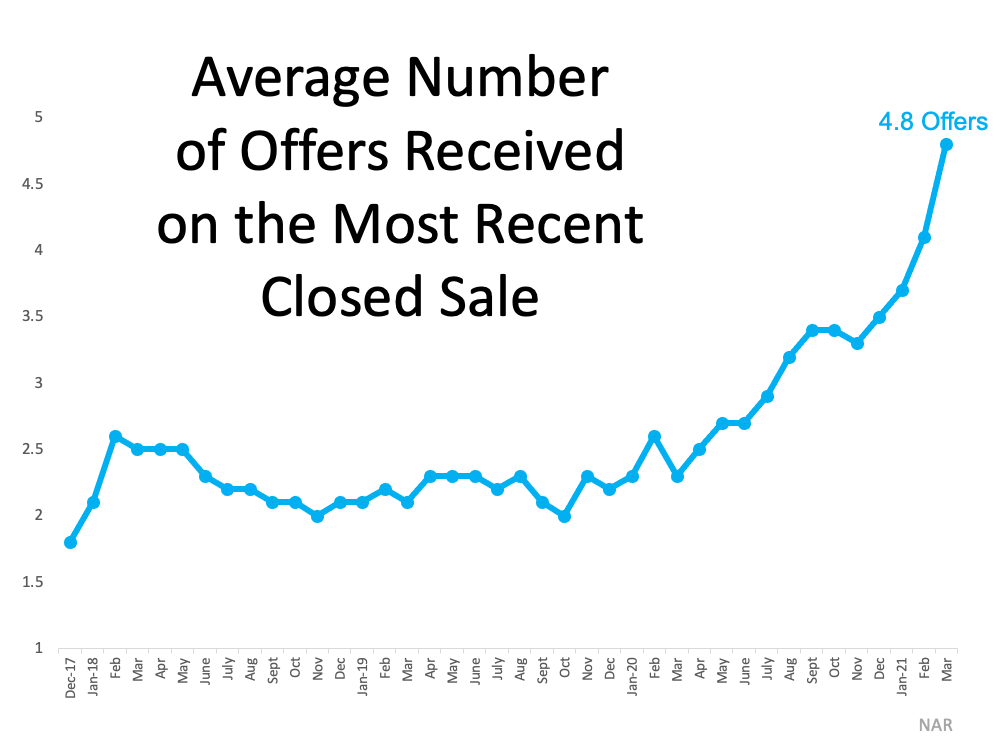
As a result of the supply and demand imbalance, homebuyers are entering bidding wars at an accelerating rate. NAR reports the average number of bids received on the most recently closed sales is 4.8 offers. This number has doubled since the first quarter of 2020 (See graph below):As buyers face increasingly tough competition while searching for homes to purchase, they’re more likely to be flexible and generous in their negotiations. This gives a seller the opportunity to choose the best buyer for their needs and be selective about things like time to close, contingencies, renovations, and more. Working with your trusted agent is the best way to determine how to navigate the negotiation process when selling your house.

3. Days on the Market

In today’s market, sellers aren’t waiting very long to find a buyer for their house, either. NAR reports:

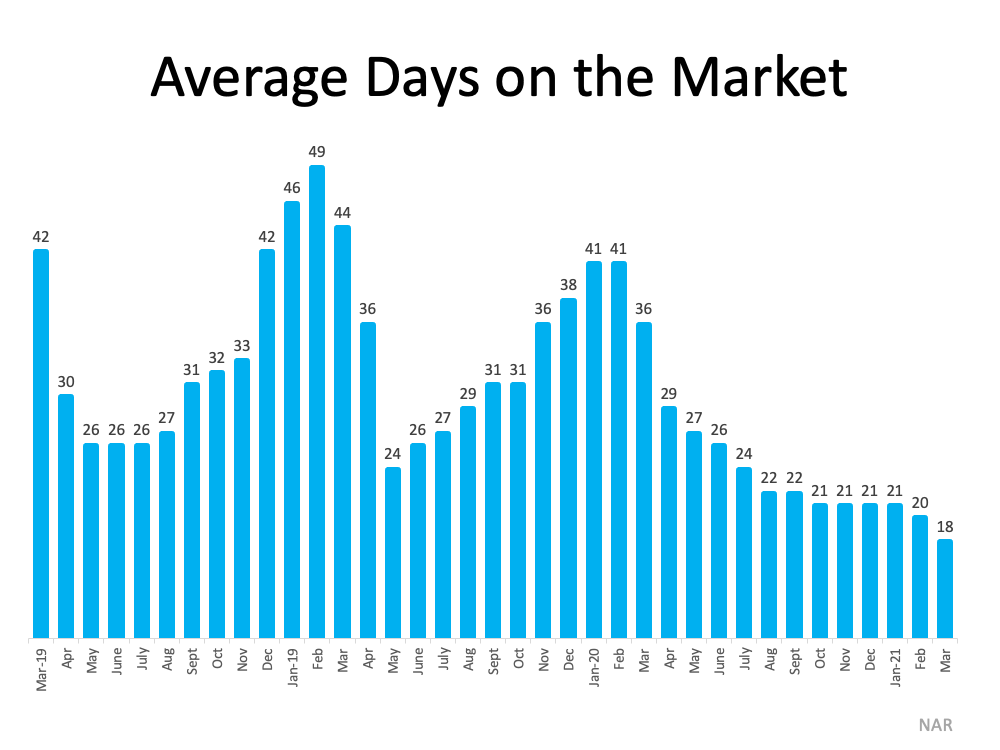
Properties typically remained on the market for 18 days in March, down from 20 days in February and from 29 days in March 2020. 83% of the homes sold in March 2021 were on the market for less than a month.” (See graph below):

3 Graphs Showing Why You Should Sell Your House Now | MyKCM

NAR Chief Economist Lawrence Yun explains:

“The sales for March would have been measurably higher, had there been more inventory…Days-on-market are swift, multiple offers are prevalent, and buyer confidence is rising.”

Bottom Line

If you’re thinking about moving, these three graphs clearly show that it’s a great time to sell your house. Let’s connect today so you can learn more about the opportunities in our local area.


Millennials In The Lead for Home Purchases, More Than Half Of All Home Purchase Applications


According to the CoreLogic Loan Application Database[1], prior to 2020, while millennial home purchase applications comprised less than half of all purchase applications, their share grew from 33% in 2014 to 47% in 2019, rising about 2 to 4 percentage points per year. This annual increase is consistent with the cohort of millennials reaching 33 years of age, the peak homebuying age.

But in 2020, the share of millennials in the homebuying market soared 7 percentage points in 2020, reaching 54% of all purchase applications (Figure 1). And while half of the increase is consistent with the natural growth rate seen since 2014, the additional half of the 2020 jump was likely driven by the pandemic. In other words, the increase was accelerated by record low mortgage interest rate and flexibility to work remotely.

Figure 2 shows U.S. population distribution by age, highlighting the largest demographic cohort reaching the peak age of FTHB on the left axis. The right axis of the chart, displayed by the green line, represents first-time home-purchase loan applications per 1,000 persons in 2020.

Younger millennials below 30 have yet to enter homeownership, so demand from millennials is likely to remain strong over the coming years. At the same time, more older millennials are likely to transition to repeat homebuyers. The share of millennial repeat buyer home-purchase applications was already 35% in 2020, just 4 percentage points lower than Gen X’ share.


Happy Anniversary | How Much Is My House Worth Today?

Congratulations Kevin and Danielle! Happy Anniversary to my clients who closed on this day March 4th, 2016 in Springfield, VA.

Located in the Glenwood Manor development, the couple purchased a 1700 sqft., 3 bedroom, 2.5 bath townhome for $379,000. 5 years later, for similar properties (any three bedrooms sold in the last 365 days), the median Close Price was $478,500 and the median Days On Market was 5. 

The decision to purchase instead of renting positioned them nicely to build equity that they now can utilize for their next move.

If you have been debating owning versus renting, understanding the market and how either decision could effect you in 3-5 years is worth discussing.

  • This information is not meant to be used as an appraisal. This is a snapshot of the Glenwood Manor development listings sold in the last 365 days as of March 4, 2021.

‘Peculiar’ Economy to Stabilize in Second Half of 2021?

Leading economists say the labor, housing, and stock markets will reach crucial markers that will indicate the recovery’s progress. From NAR’s virtual Real Estate Forecast Summit, Dec. 10

Housing Market

The housing market has been a bright spot this year, though inventory is a challenge.  The problem, Berson says, isn’t just homebuilding and permitting but also getting prospective sellers to put their homes on the market. “Hopefully, people will feel good about strangers coming into their home once there’s a vaccine,” he said.  – Realtor Magazine

Click the link for more, source: ‘Peculiar’ Economy to Stabilize in Second Half of 2021?

CoreLogic – Three-Year Housing and Mortgage Outlook

  • 30-year fixed-rate loans to remain below 3% during early 2021 and average about 3.2% during the next three years.
  • Millennials will add substantial demand for housing over the next few years.
  • Home prices projected to rise in most metro areas, albeit slower than in recent years.

2020 was a truly unprecedented year. With it behind us, let’s look ahead at three housing market trends that are likely during the next three years.

Figure 1: Mortgage Rates Are Forecast to Remain Low

First, exceptionally low mortgage rates are likely to be around for an extended period. We expect 30-year fixed-rate loans to remain below 3% during early 2021 and average about 3.2% during the next three years. This would be nearly a percentage point lower than the average over the 2010-2019 decade. These low rates will provide an excellent opportunity for families with good credit to buy or refinance homes.

Figure 2: Large Demographic Tailwind Has Arrived

Second, Millennials will add substantial demand for housing over the next few years. Looking at America’s population by age, the largest numbers of Millennials are those aged 28 to 30. With 33 as the median age of recent first-time buyers, demographic forces will add an important tailwind to home-buying demand. In fact, we expect home sales relative to the housing stock, a measure of home “turnover”, in 2021 to 2023 to be above the average annual turnover rate of the prior two decades.

Figure 3: Home Price Forecast to Rise Slower than Last Decade

Third, we expect home prices to rise in most neighborhoods, albeit at a more modest pace than in recent years. Price appreciation is expected to average 2.5% per year during the next three years, compared with 4.8% per year during the prior decade. One reason for slower value growth is because we expect for-sale inventory will increase. 2020’s pandemic delayed new construction and led many prospective sellers to postpone listings. Once the coronavirus dissipates or a vaccine is widely available, we expect to see the number of new and existing homes listed for sale to rise, helping to ease price appreciation. One caveat: while we predict most communities will see gradual price growth, some metros that have been especially hard hit by the pandemic recession will likely have price declines.

Low mortgage rates, growing numbers of first-time buyers, and gradually rising home values are three housing market trends we expect during the next three years.
© 2020 CoreLogic, Inc. All rights reserved.


START TO FINISH – 406 DAYS, SO MANY GREAT THINGS HAVE COME WITH TIME AND PATIENCE

No it’s not the pandemic; there we can only follow safety precautions and hope.

Rather it’s one of my clients’ timeline to Sell and Buy during 2020. How did they go from a home of 9 yrs, with three school-aged children and two full time working parents into a new build that will suit their family for the next 20+ years during an unimaginable world wide pandemic? One step at a time.


We first connected on October 20, 2019. From there, we developed an individual step by step plan of ‘how to’ execute their real estate goals.
Following that plan led them to identifying the location, negotiating with the builder of their new home, and ratifying on Jan 1, 2020.
Coordinating with the builder, designers, lender and title resulted in closing on October 2, 2020, three months behind schedule due to pandemic related delays.

Then it was time to list their home of 9 years.

Despite being three months behind our original timeline, we referred back to the step by step plan we had created.
Without skipping a beat, my clients stuck to the plan and completed everything we had discussed to get the house ready for market.
We listed on a Thursday, ratified 5 days later on that Monday and closed in 21 days on November 30, 2020.


09.28.2020 Maryland Real Estate Trends Echos Much Of The Countries


August Housing Data Reveals a Robust Summer Market Amidst Declines in Inventory

  • Median Sale Price is up 9.7%
  • Average Sale Price up 11.2%
  • Months of Inventory down 60% to 1.4 months
  • Median days on market are down from 22 to 9
  • Seven of Maryland’s rural counties have seen over 20 percent increases in average prices over last year.
ANNAPOLIS, MD – September 28, 2020 Maryland’s August housing market demonstrated substantial recovery from spring’s COVID-related disruptions, according to housing statistics released by Maryland REALTORS®*. Data from June through August show both an increase in average and median home prices, and a decline in months of available inventory, echoing nationwide trends and sparking concern over housing imbalances.

“The average sales price increased year-over-year from $361,823 to $402,452 and the median price increased from $310,000 to $340,000, growth of 11.2 percent and 9.7 percent, respectively” said Maryland REALTORS® President John A. Harrison. “Months of inventory dropped 60 percent to just 1.4 months, compared to 3.5 last year, which is a historic low for the state. Moreover, the median days on market fell from 22 to 9 which aligns with stories we’ve heard of bidding wars and homes selling within hours of hitting the market.”

“The most notable, but unsurprising, feature of the current housing market is the sharp rise in activity in rural areas,” said Harrison. Seven of Maryland’s rural counties have seen over 20 percent increases in average prices over last year. With the rise in working from home, commute times are less of a factor. That and the relative affordability of rural areas make urban and some suburban communities less attractive. “The pandemic has prompted individuals and families to reimagine their housing requirements, often desiring home office space and more expansive outdoor living areas.”