Back of man starting at huge dollar bill with arrow in front heading lower

MARCH 30, 2023

Mortgage Rates Hit Lowest Level in 6 Weeks

By Matt Ott

At 6.32%, the average 30-year, fixed-rate mortgage declined from last week’s average 6.42% – a ray of hope for buyers seeking to secure a home this spring.

WASHINGTON – The average long-term U.S. mortgage rate inched down this week to its lowest level in six weeks, just as the spring buying season gets underway.

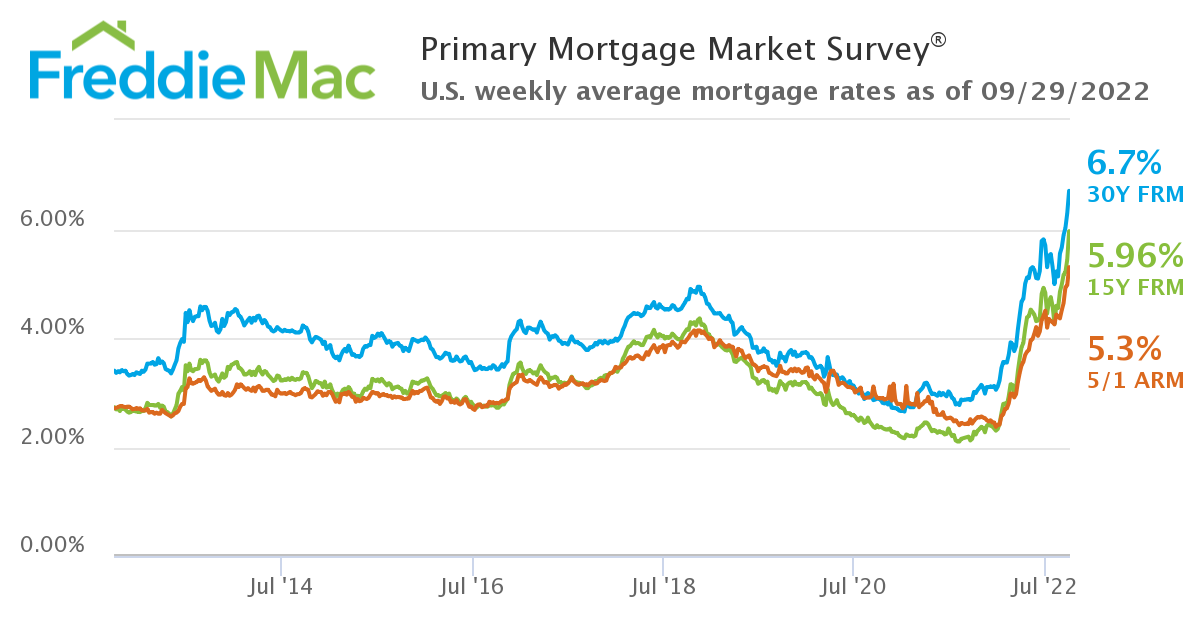
Mortgage buyer Freddie Mac reported Thursday that the average on the benchmark 30-year rate fell for the third straight week to 6.32%, from 6.42% last week. The average rate a year ago was 4.67%.

The recent decline in mortgage rates is good news for prospective homebuyers, as many were pushed to the sidelines during the past year as the Federal Reserve cranked up its main borrowing rate nine straight times in a bid to bring down stubborn, four-decade high inflation.

Also helping buyers, home prices appear to be leveling off. The national median home price slipped 0.2% from February last year to $363,000, marking the first annual decline in 13 years, according to the National Association of Realtors.

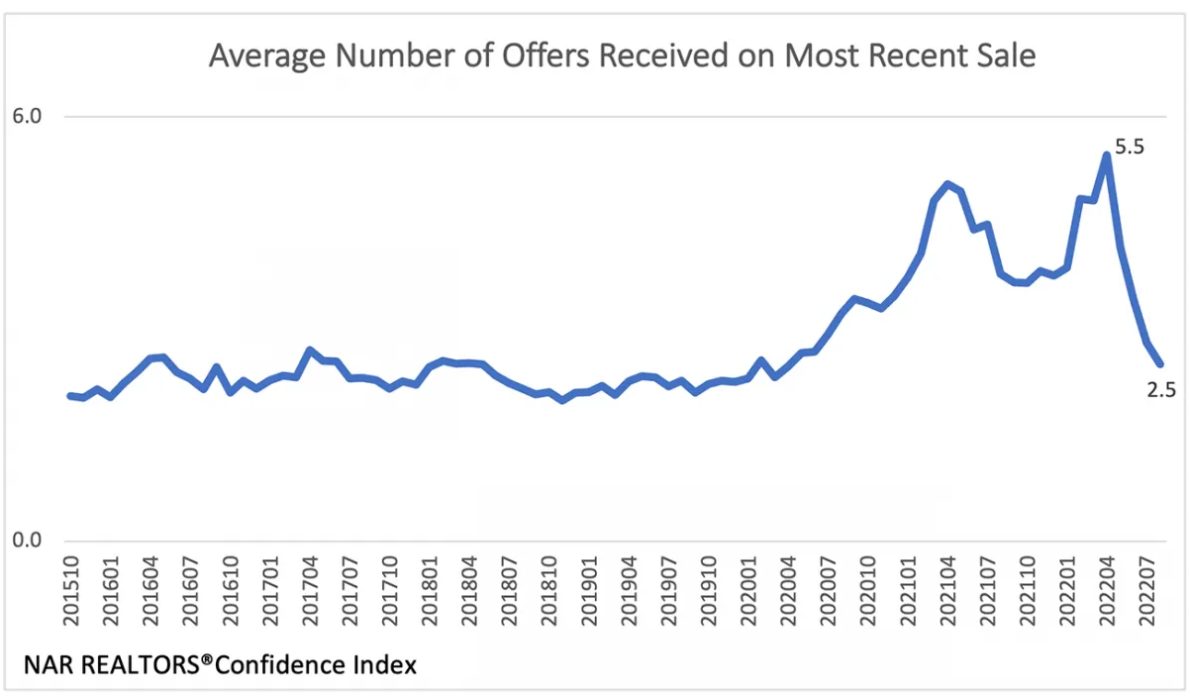
One thing that hasn’t gotten much better is the supply of homes.

“Over the last several weeks, declining rates have brought borrowers back to the market, but as the spring home buying season gets underway, low inventory remains a key challenge for prospective buyers,” said Sam Khater, Freddie Mac’s chief economist.

Rising borrowing costs can add hundreds of dollars a month in costs for homebuyers and put the brakes on the housing market. Before surging 14.5% in February, sales of existing homes had fallen for 12 straight months to the slowest pace in more than a dozen years.

In 2022, existing U.S. home sales fell 17.8% from 2021, the weakest year for home sales since 2014 and the biggest annual decline since the housing crisis began in 2008, the National Association of Realtors reported earlier this year.

The average long-term rate hit 7.08% in the fall – a two-decade high – as the Federal Reserve quickly cranked up its key lending rate with multiple jumbo hikes in a bid to cool the economy and stymie persistent, four-decade high inflation.

In their latest quarterly economic projections, the policymakers forecast that they expect to raise that key rate just once more – from its new level of about 4.9% to 5.1%, the same peak they had projected in December.

While the Fed’s rate hikes do impact borrowing rates across the board for businesses and families, rates on 30-year mortgages usually track the moves in the 10-year Treasury yield, which lenders use as a guide to pricing loans. Investor expectations for future inflation, global demand for U.S. Treasurys and what the Federal Reserve does with interest rates can also influence the cost of borrowing for a home.

Treasury yields have fluctuated wildly since the collapse of two mid-size U.S. banks two weeks ago. The yield on the 10-year Treasury, which helps set rates for mortgages and other important loans, was 3.57% Thursday, but had been above 4% early in March.

The rate for a 15-year mortgage, popular with those refinancing their homes, fell this week to 5.56% from 5.68% last week. It was 3.83% one year ago.

Copyright 2023 The Associated Press. All rights reserved. This material may not be published, broadcast, rewritten or redistributed without permission.


Scott Bradley Brixen – ListReports Blog

Real Estate News

Interest rates for the average 30-yr, fixed-rate mortgage according to Freddie Mac’s PMMS hit:

4% in March 😟
5% in April 😰
6% in early-September 😨
7% (well, almost) in late-September 😱

The slowdown continues, but we have yet to see the impact of the most recent (massive) jump in mortgage rates on homebuyer demand.

August existing home sales dropped for the 7th straight month. Price growth decelerated further to “just” 8% YoY. [Source: Realtor.com]

Meanwhile, pending sales for August dropped 2% MoM and 24% YoY. The NAR now forecasts existing home sales to fall 15% YoY in 2022, with new home sales down 21% YoY. [Source: NAR]

Case-Shiller Index

Home price growth slowed to 15.8% YoY in July, from 18.1% YoY in June. That may not seem like much, but it’s the biggest 1-month drop in the index’s history.

Case-Shiller is the gold standard for home price appreciation because it tracks the sales prices of very similar homes across 20 big cities. It’s an ‘apples to apples’ comparison. But that accuracy comes at a cost…the data is 2 months old by the time we get it.

Mortgage Market

An extremely volatile week for the bond market (after the Fed raised rates 75bps) saw 30-year, fixed-rate mortgages briefly exceed 7% [with no points], before dropping back to around 6.75%. [Source: Mortgage News Daily]

Freddie Mac’s closely watched PMMS survey saw the interest rate on the average 30-year, fixed-rate mortgage climb to 6.7%. Keep in mind that this figure includes an average 0.9 points purchased. Without those points, the rate would have been at/ahead of 7%.

Still a Seller’s Market

Demand is falling and inventory has risen, but in most markets, well-priced homes are still selling very, very quickly.

In fact, the average Days on Market for sold properties has only edged up from 14 (in June & July) to 16 in August. In 2011 that figure was 96! Looked at another way, 81% of homes sold in August had been on the market less than a month.

That said, the average number of offers received for each property sold has plunged from a frenzied 5.5 in April 2022 to 2.5 in August. That’s actually getting pretty close to “normal” pre-pandemic levels of competition.

National Housing Stats

They Said It

“Success demands singleness of purpose. You need to be doing fewer things for more effect instead of doing more things with side effects. It is those who concentrate on one thing at a time who advance in this world.” — Gary Keller, The One Thing

“Our house is clean enough to be healthy and dirty enough to be happy” — Robyn Griggs Lawrence

Inspiration

The average duration of homeownership in the US is around 12 years. So if someone in your sphere of influence (SOI) bought a home in the last few years, there’s no reason to actively stay in touch with them, right? Wrong. Take the inverse of 12 (that’s 1/12) and you get 8.3%.

This means that, mathematically, 8% of your SOI is going to move in the next year…for reasons that you (and often they) couldn’t have predicted. Hockey legend Wayne Gretzky said “you miss 100% of the shots you don’t take.” In real estate, you probably lose 80–90% of the past clients that you don’t stay in contact with.


Experts Agree: Options Are Improving for Buyers

Experts Agree: Options Are Improving for Buyers [INFOGRAPHIC] | MyKCM

Some Highlights

  • Buyers hoping for more homes to choose from may be in luck as housing inventory begins to rise. Many experts agree – new sellers listing their homes is great news for buyers and the overall market.
  • Although the supply increases are modest, more homes means more options for buyers. A rise in inventory may also help slow the price gains we’ve seen recently and could be a sign of good things to come.
  • If you’re searching for a home, rising inventory is welcome news. Let’s connect today to discuss new listings in our area.

U.S. Homeowners Enjoyed $1.9 Trillion of Equity Gains in Early 2021

CoreLogic’s newly released Homeowner Equity Report for the first quarter of 2021 shows U.S. homeowners with mortgages (which account for roughly 62% of all properties) have seen their equity increase by 19.6% year over year, representing a collective equity gain of over $1.9 trillion, and an average gain of $33,400 per borrower, since the first quarter of 2020.

Residential News » Irvine Edition | By Michael Gerrity | June 10, 2021 8:59 AM ET

While the coronavirus pandemic created economic uncertainty for many, the continued acceleration in home prices over the last year has meant existing homeowners saw a notable boost in home equity. The accumulation of equity has become critically important to homeowners deciding on their post-forbearance options. In contrast to the financial crisis, when many borrowers were underwater, borrowers today who are behind on mortgage payments can tap into their equity and sell their home rather than lose it through foreclosure. These conditions are reflected in a recent CoreLogic survey, with 74% of current homeowners with mortgages noting they are not concerned with owing more on their home than it is worth within the next five years.

“Homeowner equity has more than doubled over the past decade and become a crucial buffer for many weathering the challenges of the pandemic,” said Frank Martell, president and CEO of CoreLogic. “These gains have become an important financial tool and boosted consumer confidence in the U.S. housing market, especially for older homeowners and baby boomers who’ve experienced years of price appreciation.”

WPJ News | Frank Nothaft, Freddie Mac's chief economist
Dr. Frank Nothaft

“Double-digit home price growth in the past year has bolstered home equity to a record amount. The national CoreLogic Home Price Index recorded an 11.4% rise in the year through March 2021, leading to a $216,000 increase in the average amount of equity held by homeowners with a mortgage,” said Dr. Frank Nothaft, chief economist for CoreLogic. “This reduces the likelihood for a large number of distressed sales of homeowners to emerge from forbearance later in the year.”

Negative equity, also referred to as underwater or upside down, applies to borrowers who owe more on their mortgages than their homes are currently worth. As of the first quarter of 2021, negative equity share, and the quarter-over-quarter and year-over-year changes, were as follows:

  • Quarterly change: From the fourth quarter of 2020 to the first quarter of 2021, the total number of mortgaged homes in negative equity decreased by 7% to 1.4 million homes, or 2.6% of all mortgaged properties.
  • Annual change: In the fourth quarter of 2020, 1.8 million homes, or 3.4% of all mortgaged properties, were in negative equity. This number decreased by 24%, or 450,000 properties, in the first quarter of 2021.
  • National aggregate value: The national aggregate value of negative equity was approximately $273 billion at the end of the first quarter of 2021. This is down quarter over quarter by approximately $8.1 billion, or 2.9%, from $281.1 billion in the fourth quarter of 2020, and down year over year by approximately $13.3 billion, or 4.6%, from $286.3 billion in the first quarter of 2020.

Because home equity is affected by home price changes, borrowers with equity positions near (+/- 5%) the negative equity cutoff are most likely to move out of or into negative equity as prices change, respectively. Looking at the first quarter of 2021 book of mortgages, if home prices increase by 5%, 195,000 homes would regain equity; if home prices decline by 5%, 260,000 would fall underwater.


Home Price Appreciation Is as Simple as Supply and Demand

Home price appreciation continues to accelerate. Today, prices are driven by the simple concept of supply and demand. Pricing of any item is determined by how many items are available compared to how many people want to buy that item. As a result, the strong year-over-year home price appreciation is simple to explain. The demand for housing is up while the supply of homes for sale hovers at historic lows.

Let’s use three maps to show how this theory continues to affect the residential real estate market.

Home Price Appreciation Is as Simple as Supply and Demand | MyKCM

Map #1 – State-by-state price appreciation reported by the Federal Housing Finance Agency (FHFA) for the first quarter of 2021 compared to the first quarter of 2020:As the map shows, certain states (colored in red) have appreciated well above the national average of 12.6%.

Home Price Appreciation Is as Simple as Supply and Demand | MyKCM

Map #2 – The change in state-by-state inventory levels year-over-year reported by realtor.com:Comparing the two maps shows a correlation between change in listing inventory and price appreciation in many states. The best examples are Idaho, Utah, and Arizona. Though the correlation is not as easy to see in every state, the overall picture is one of causation.

The reason prices continue to accelerate is that housing inventory is still at all-time lows while demand remains high. However, this may be changing.

Is there relief around the corner?

The report by realtor.com also shows the monthly change in inventory for each state.

Home Price Appreciation Is as Simple as Supply and Demand | MyKCM

Map #3 – State-by-state changes in inventory levels month-over-month reported by realtor.com:As the map indicates, 39 of the 50 states (plus the District of Columbia) saw increases in inventory over the last month. This may be evidence that homeowners who have been afraid to let buyers in their homes during the pandemic are now putting their houses on the market.

We’ll know for certain as we move through the rest of the year.

Bottom Line

Some are concerned by the rapid price appreciation we’ve experienced over the last year. The maps above show that the increases were warranted based on great demand and limited supply. Going forward, if the number of homes for sale better aligns with demand, price appreciation will moderate to more historical levels.


Experts Say You Have to Stand Out In Today’s Real Estate Market

My clients are standouts every day. Each helping to provide for and serve their community. Most recently, one runs a community farmers market, one is a federal law enforcement officer and another is a social media guru, community advocate and owner of a small business. Real estate is a people business and I get to work with some outstanding ones.

SOLD


“Laurel is an amazing professional and one of the best in the business. She is well plugged in DMV real estate network – something that comes extremely handy when you are selling your home. She came prepared with a plan to market our home and got us the price we were comfortable with in 3 days. We could not recommend her enough especially for sales in north Chevy Chase neighborhood.” – read more LMRE reviews

First Time Home Buyers


Shout out to @taylorxpatrick for recognizing me on Instagram to her thousands of followers. I feel like this is the beginning of a long standing friendship. Not only in helping you and Asia close on your first home but also working together on some custom client closing gifts.


Instant Reaction: Housing Starts, May 18, 2021


“Today’s data, showing a decline in housing starts in April, is discouraging at first glance. America is facing an epic housing shortage and more homes need to be built. The monthly data can be volatile, but the overall underlying trend is still on the upside. The year-to-date figures in 2021 for housing starts were 1.59 million units (annualized pace) compared to 1.38 million in 2020, a 15% gain. More importantly, single-family housing starts also declined in the latest month but were up 26% on a year-to-date basis.

More housing inventory will reach the market in a few months, certainly by autumn, because of the upward trend in home construction. In addition, the mortgage forbearance program will also steadily wind down, leading to further inventory. Moreover, the progress in vaccination among elderly homeowners will lead to normal life activity, including home sales that had been postponed since the onset of the pandemic.

Housing starts are projected to reach 1.6 million for all of 2021 and rise further to 1.7 million in 2022. This would mark the highest home construction activity in 15 years. It is not an overproduction, but rather an attempt to compensate for multiple years of underproduction that led to the current housing shortage.”

Lawrence Yun

Chief Economist and Senior Vice President, Research Lawrence Yun is Chief Economist and Senior Vice President of Research for the National Association of REALTORS®.

The year-to-date figures in 2021 for housing starts were 1.59 million units (annualized pace) compared to 1.38 million in 2020, a 15% gain.

Source: Instant Reaction: Housing Starts, May 18, 2021


Are We Headed For A Housing Crash? Is The Market Heading Into A Housing Bubble?

Experts Say Home Prices Will Continue to Appreciate

Experts Say Home Prices Will Continue to Appreciate | MyKCM

It’s clear that consumers are concerned about how quickly home values are rising. Many people fear the speed of appreciation may lead to a crash in prices later this year. In fact, Google reports that the search for “When is the housing market going to crash?” has actually spiked 2450% over the past month.

In addition, Jim Dalrymple II of Inman News notes:

“One of the most noteworthy things that came up in Inman’s conversations with agents was that every single one said they’ve had conversations with clients about whether or not the market is heading into a bubble.”

To alleviate some of these concerns, let’s look at what several financial analysts are saying about the current residential real estate market. Within the last thirty days, four of the major financial services giants came to the same conclusion: the housing market is strong, and price appreciation will continue. Here are their statements on the issue:

Goldman Sachs’ Research Note on Housing:

“Strong demand for housing looks sustainable. Even before the pandemic, demographic tailwinds and historically-low mortgage rates had pushed demand to high levels. … consumer surveys indicate that household buying intentions are now the highest in 20 years. … As a result, the model projects double-digit price gains both this year and next.”

Joe Seydl, Senior Markets EconomistJ.P.Morgan:

“Homebuyers—interest rates are still historically low, though they are inching up. Housing prices have spiked during the last six-to-nine months, but we don’t expect them to fall soon, and we believe they are more likely to keep rising. If you are looking to purchase a new home, conditions now may be better than 12 months hence.”

Morgan Stanley, Thoughts on the Market Podcast:

“Unlike 15 years ago, the euphoria in today’s home prices comes down to the simple logic of supply and demand. And we at Morgan Stanley conclude that this time the sector is on a sustainably, sturdy foundation . . . . This robust demand and highly challenged supply, along with tight mortgage lending standards, may continue to bode well for home prices. Higher interest rates and post pandemic moves could likely slow the pace of appreciation, but the upward trajectory remains very much on course.”

Merrill Lynch’s Capital Market Outlook:

“There are reasons to believe that this is likely to be an unusually long and strong housing expansion. Demand is very strong because the biggest demographic cohort in history is moving through the household-formation and peak home-buying stages of its life cycle. Coronavirus-related preference changes have also sharply boosted home buying demand. At the same time, supply is unusually tight, with available homes for sale at record-low levels. Double-digit price gains are rationing the supply.”

Bottom Line

If you’re concerned about making the decision to buy or sell right now, let’s connect to discuss what’s happening in our local market.


What’s Driving The Sellers Advantage? An Opportunity For Homeowners Who Are Ready To Move This Season.

3 Graphs Showing Why You Should Sell Your House Now

3 Graphs Showing Why You Should Sell Your House Now | MyKCM

There’s no doubt that 2021 is the year of the seller when it comes to the housing market. If you’re a homeowner thinking of moving to better suit your changing needs, now is the perfect time to do so. Low mortgage rates are in your favor when you’re ready to purchase your dream home, and high buyer demand may give you the leverage you need to negotiate the best contract terms on the sale of your house. Here’s a look at what’s driving this sellers’ advantage and why there’s so much opportunity for homeowners who are ready to move this season.

1. Historically Low Inventory

The National Association of Realtors (NAR) explains:

 “Total housing inventory at the end of March amounted to 1.07 million units, up 3.9% from February’s inventory . . . Unsold inventory sits at a 2.1-month supply at the current sales pace, marginally up from February’s 2.0-month supply and down from the 3.3-month supply recorded in March 2020.”

3 Graphs Showing Why You Should Sell Your House Now | MyKCM

Even with a slight rise in the number of houses for sale this spring, inventory remains near an all-time low (See graph below):High buyer interest is creating a major imbalance between supply and demand, but as the small uptick in inventory shows, sellers are beginning to reenter the market. Selling your house now enables you to take advantage of buyer demand and get the most attention for your house – before more listings come to the market later this year.

2. Frequent Bidding Wars

3 Graphs Showing Why You Should Sell Your House Now | MyKCM

As a result of the supply and demand imbalance, homebuyers are entering bidding wars at an accelerating rate. NAR reports the average number of bids received on the most recently closed sales is 4.8 offers. This number has doubled since the first quarter of 2020 (See graph below):As buyers face increasingly tough competition while searching for homes to purchase, they’re more likely to be flexible and generous in their negotiations. This gives a seller the opportunity to choose the best buyer for their needs and be selective about things like time to close, contingencies, renovations, and more. Working with your trusted agent is the best way to determine how to navigate the negotiation process when selling your house.

3. Days on the Market

In today’s market, sellers aren’t waiting very long to find a buyer for their house, either. NAR reports:

Properties typically remained on the market for 18 days in March, down from 20 days in February and from 29 days in March 2020. 83% of the homes sold in March 2021 were on the market for less than a month.” (See graph below):

3 Graphs Showing Why You Should Sell Your House Now | MyKCM

NAR Chief Economist Lawrence Yun explains:

“The sales for March would have been measurably higher, had there been more inventory…Days-on-market are swift, multiple offers are prevalent, and buyer confidence is rising.”

Bottom Line

If you’re thinking about moving, these three graphs clearly show that it’s a great time to sell your house. Let’s connect today so you can learn more about the opportunities in our local area.


Millennials In The Lead for Home Purchases, More Than Half Of All Home Purchase Applications


According to the CoreLogic Loan Application Database[1], prior to 2020, while millennial home purchase applications comprised less than half of all purchase applications, their share grew from 33% in 2014 to 47% in 2019, rising about 2 to 4 percentage points per year. This annual increase is consistent with the cohort of millennials reaching 33 years of age, the peak homebuying age.

But in 2020, the share of millennials in the homebuying market soared 7 percentage points in 2020, reaching 54% of all purchase applications (Figure 1). And while half of the increase is consistent with the natural growth rate seen since 2014, the additional half of the 2020 jump was likely driven by the pandemic. In other words, the increase was accelerated by record low mortgage interest rate and flexibility to work remotely.

Figure 2 shows U.S. population distribution by age, highlighting the largest demographic cohort reaching the peak age of FTHB on the left axis. The right axis of the chart, displayed by the green line, represents first-time home-purchase loan applications per 1,000 persons in 2020.

Younger millennials below 30 have yet to enter homeownership, so demand from millennials is likely to remain strong over the coming years. At the same time, more older millennials are likely to transition to repeat homebuyers. The share of millennial repeat buyer home-purchase applications was already 35% in 2020, just 4 percentage points lower than Gen X’ share.