NAR Chief Economist Addresses Senate Committee

nar building washington dc

JULY 22, 2022

By Kerry Smith

Sales will weaken and for-sale inventory will grow, but it won’t do much to help affordability, Chief Economist Lawrence Yun said.

WASHINGTON – National Association of Realtors® (NAR) Chief Economist Lawrence Yun spoke before the U.S. Senate Committee on Banking, Housing and Urban Affairs as they dig deeper in an attempt to understand what’s happening in the U.S. housing market.

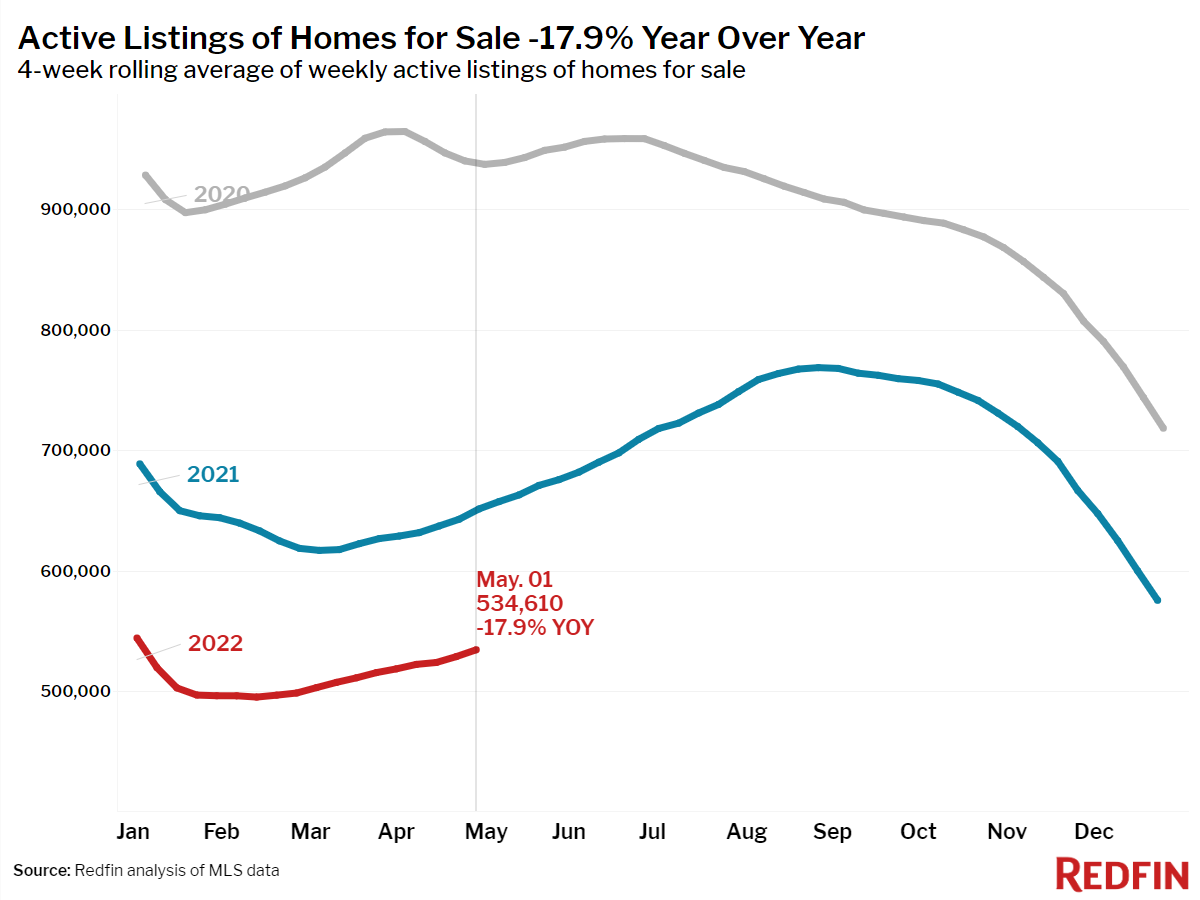
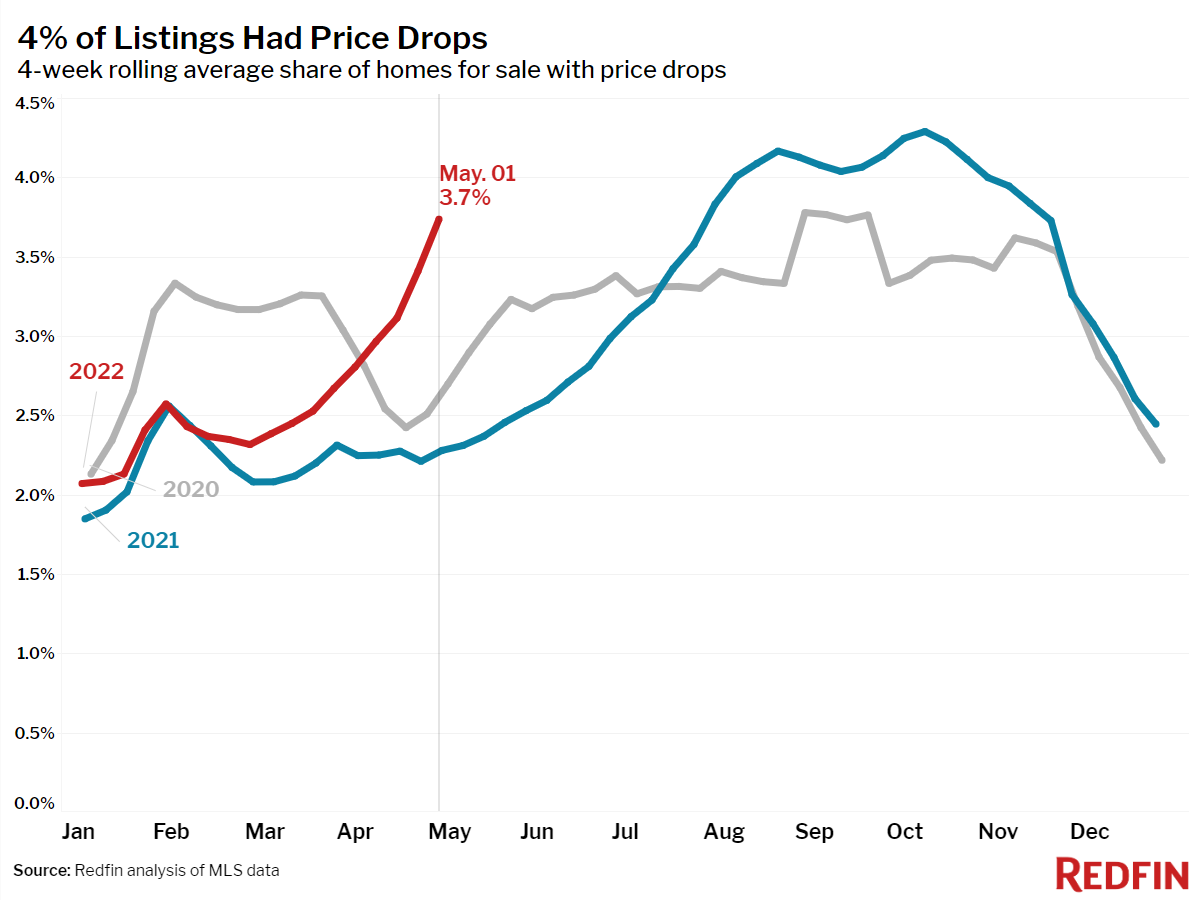
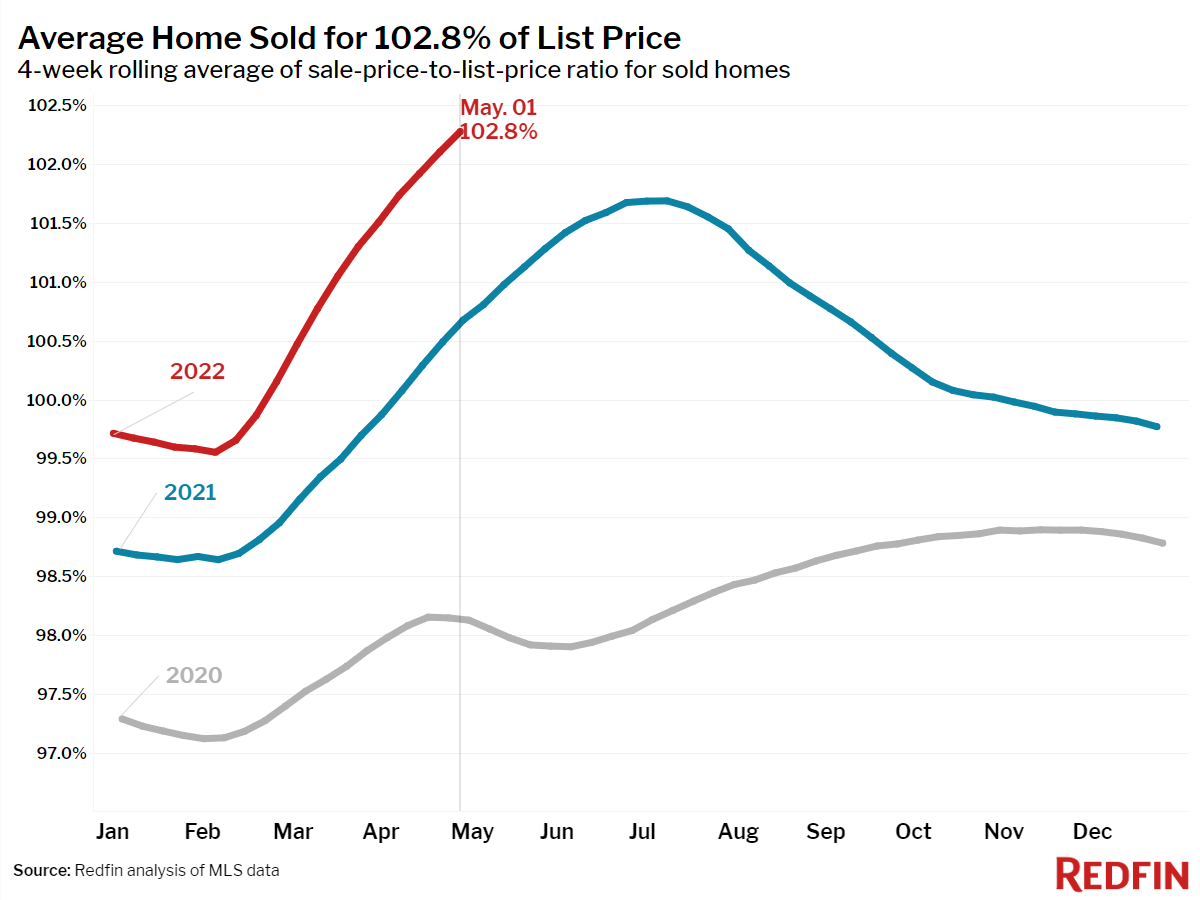
Yun told the committee that he doesn’t foresee a nationwide decline in home prices despite indications that price growth is set to slow. He testified that the potential for weaker sales should increase available for-sale inventory in some markets, but not enough to diminish persistent affordability constraints that, for many Americans, have kept homeownership out of reach for years.

“In the near term, I do not expect the situation to change appreciably,” Yun said Thursday. “Historic undersupply in the market, combined with continued demand, will likely drive ongoing issues with affordability for many Americans.

“Any short-term price adjustments, if they occur, will be less consequential compared to the immense longer-term housing affordability challenges we face as a country.”

Thursday’s hearing, Priced Out: The State of Housing in America, was recorded and can be viewed online.

The committee hearings come as the nation confronts a 6-million-unit housing shortage. The decades-in-the-making phenomenon has helped sustain year-over-year price growth for a record 124 consecutive months. A study of other circumstances influencing the market is also particularly compelling given COVID’s impact on U.S. housing and the more recent fluctuations in mortgage interest rates.

“When the Federal Reserve essentially went all-in in the early months of the pandemic … the decline in mortgage rates and the cautious reopening of the economy boosted housing demand,” said Yun. “The housing market always responds to changes in mortgage rates.”

Interest rates, which had been consistently in the 4-to-5% range in the decade preceding COVID-19, hovered near record lows of around 3% throughout much of 2020 and 2021. NAR’s most recent existing home sales report found that the average commitment rate for a 30-year, conventional, fixed-rate mortgage in June was up to 5.52%.

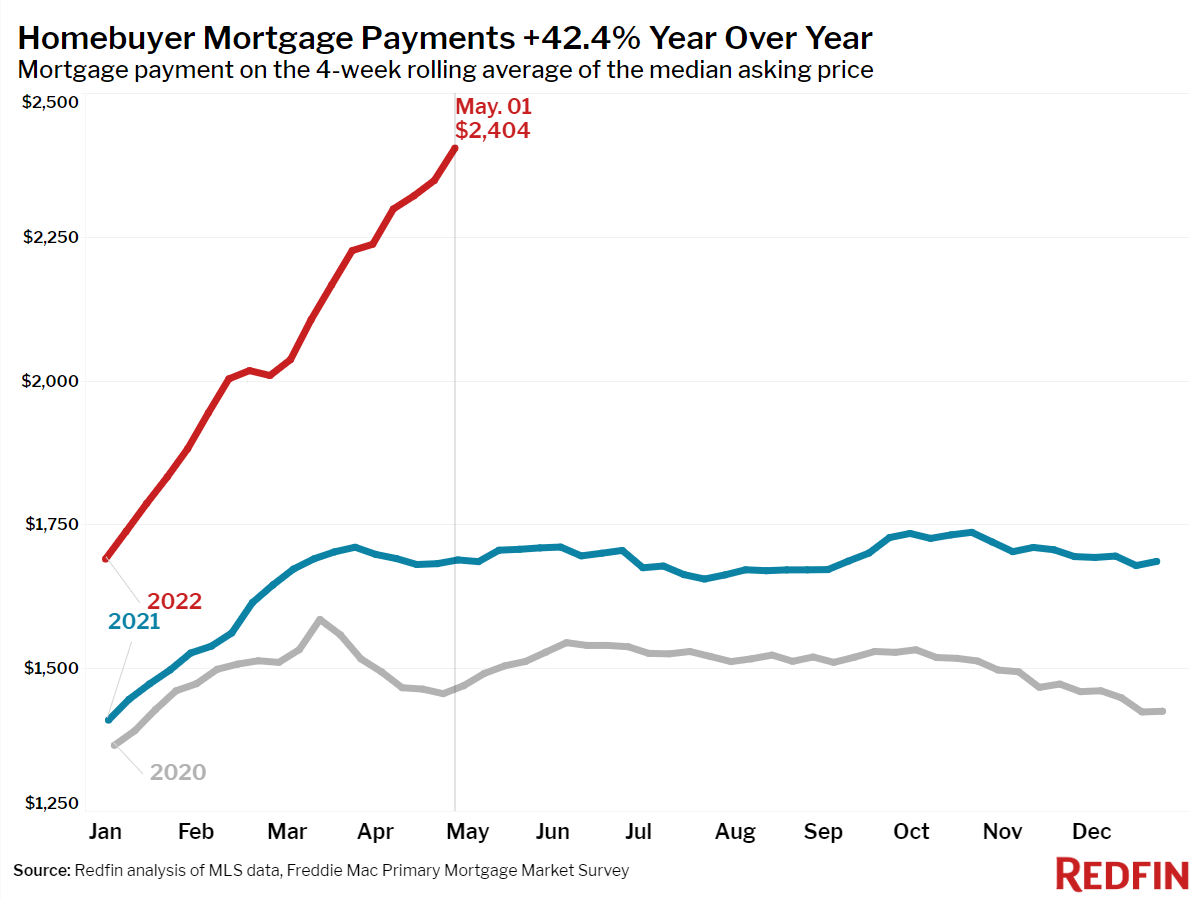
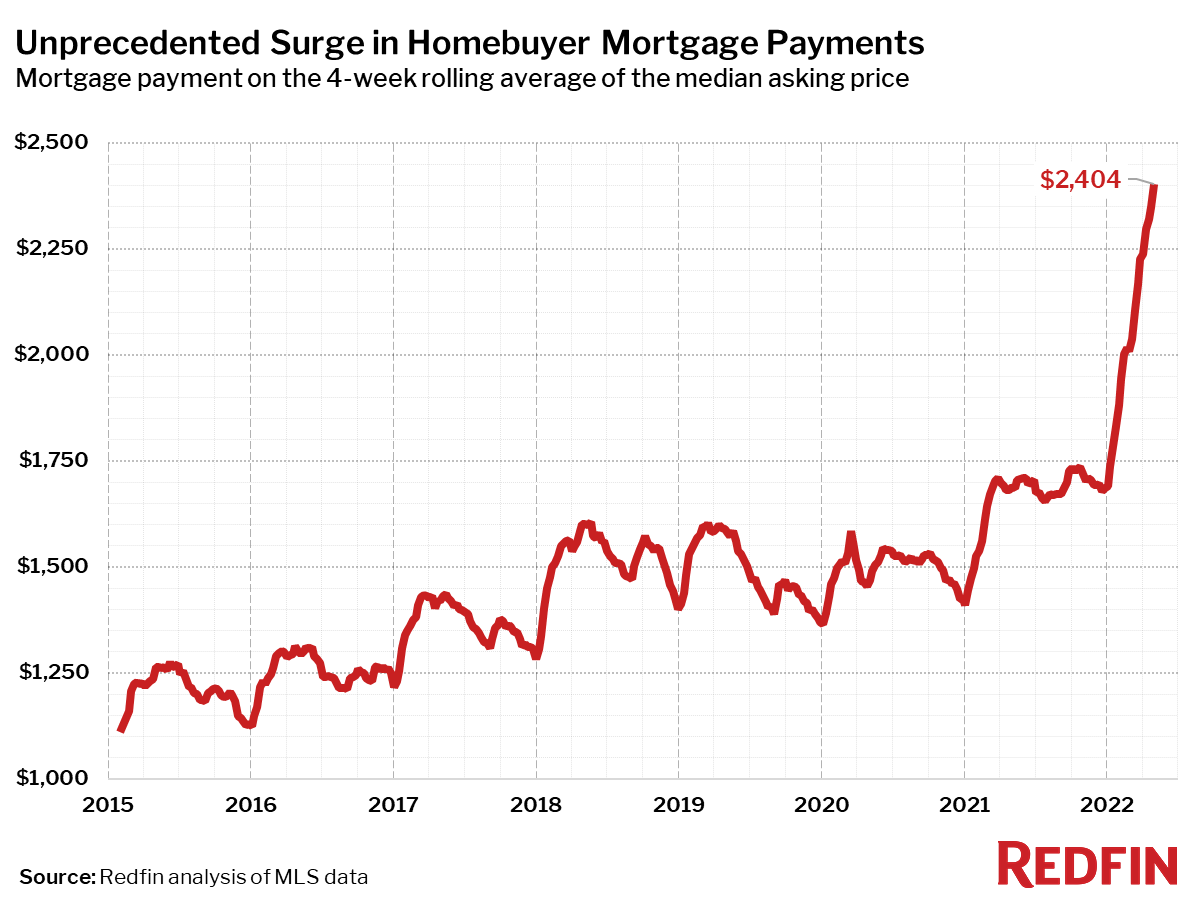
“Any increases in available inventory observed over the first half of this year have been offset by the corresponding increases in consumer costs,” Yun said on Capitol Hill, explaining that rate increases of roughly 2.5 percentage points have added about $800 per month to a median-priced house payment.

“This affordability crunch is felt most acutely as we move down the income scale and by minority households, given the current income distribution in America,” he continued. “That is why housing supply must be addressed to moderate home price and rent gains.”

© 2022 Florida Realtors®


Existing-Home Sales Retract 2.4% in April

May 19, 2022

Media Contact:  Quintin Simmons 202-383-1178

Key Highlights

  • Existing-home sales fell for the third straight month to a seasonally adjusted annual rate of 5.61 million. Sales were down 2.4% from the prior month and 5.9% from one year ago.
  • With slower demand, the inventory of unsold existing homes climbed to 1.03 million by the end of April, or the equivalent of 2.2 months of the monthly sales pace.
  • The median existing-home sales price increased at a slower year-over-year pace of 14.8% to $391,200.

“Higher home prices and sharply higher mortgage rates have reduced buyer activity,” said Lawrence Yun, NAR’s chief economist. “It looks like more declines are imminent in the upcoming months, and we’ll likely return to the pre-pandemic home sales activity after the remarkable surge over the past two years.”

Read full NAR article


Housing Market Update: More Sellers Drop Their Prices, But Buyers Find Little Relief

May 6, 2022 by Tim Ellis of Redfin

Median Sale Price

Homebuying is as competitive and costly as ever as soaring mortgage rates make the market less inviting for many would-be sellers.

The share of home sellers who dropped their asking price shot up to a six-month-high of 15% for the four weeks ending May 1, up from 9% a year earlier. The 5.9% increase is the largest annual gain on record in Redfin’s weekly housing data back through 2015. For homebuyers, the typical monthly mortgage payment skyrocketed a record 42% to a new high during the same period. Although a growing share of sellers are responding to the palpable drop in homebuyer demand by lowering their prices, sellers remain far outnumbered by buyers, so the typical home flies off the market at the fastest pace on record and for more than its asking price.

“Homebuyers continue to be squeezed in nearly every way possible, which is causing some to take a step back from the market,” said Redfin Chief Economist Daryl Fairweather. “Unfortunately for buyers hoping to find a deal as competition cools, sellers are pulling back even faster, which is keeping the market deep in seller’s territory. So even though price drops are becoming more common, most homes are still selling above asking price and in record time.”

Leading indicators of homebuying activity:

Median Asking Price
  • Fewer people searched for “homes for sale” on Google—searches during the week ending April 30 were down 7% from a year earlier.
  • The seasonally-adjusted Redfin Homebuyer Demand Index—a measure of requests for home tours and other home-buying services from Redfin agents—was down 1% year over year during the week ending May 1. It dropped 10% in the past four weeks, compared with a 1% decrease during the same period a year earlier.
  • Touring activity from the first week of January through May 1 was 24 percentage points behind the same period in 2021, according to home tour technology company ShowingTime.
  • Mortgage purchase applications were down 11% from a year earlier, while the seasonally-adjusted index increased 4% week over week during the week ending April 29.
  • For the week ending May 5, 30-year mortgage rates increased to 5.27%—the highest level since August 2009.

Key housing market takeaways for 400+ U.S. metro areas:

Unless otherwise noted, the data in this report covers the four-week period ending May 1. Redfin’s housing market data goes back through 2012.

Data based on homes listed and/or sold during the period:

  • The median home sale price was up 17% year over year—the biggest increase since August—to a record $396,125.
  • The median asking price of newly listed homes increased 16% year over year to $408,458, a new all-time high.
  • The monthly mortgage payment on the median asking price home rose to a record high of $2,404 at the current 5.27% mortgage rate. This was up 42%—an all-time high—from $1,688 a year earlier, when mortgage rates were 2.96%.
  • Pending home sales were down 4% year over year, the largest decrease since mid-February.
  • New listings of homes for sale were down 6% from a year earlier, and have been down from 2021 since mid-March.
  • Active listings (the number of homes listed for sale at any point during the period) fell 18% year over year.
  • 56% of homes that went under contract had an accepted offer within the first two weeks on the market, up from 54% a year earlier, down less than a percentage point from the record high during the four-week period ending March 27.
  • 42% of homes that went under contract had an accepted offer within one week of hitting the market, up from 41% a year earlier, down less than a percentage point from the record high during the four-week period ending March 27.
  • Homes that sold were on the market for a record-low median of 15.5 days, down from 21.2 days a year earlier.
  • A record 56% of homes sold above list price, up from 47% a year earlier.
  • On average, 3.7% of homes for sale each week had a price drop. Overall, 14.9% dropped their price in the past four weeks, up from 11.2% a month earlier and 9.1% a year ago. This was the highest share since mid-November.
  • The average sale-to-list price ratio, which measures how close homes are selling to their asking prices, rose to an all-time high of 102.8%. In other words, the average home sold for 2.8% above its asking price. This was up from 101% a year earlier.

Refer to our metrics definition page for explanations of all the metrics used in this report.

Median Mortgage Payment
Median Mortgage Payment Since 2015
Pending Sales
New Listings
Active Listings
Price Drops
Sale-to-List

How Homeownership Can Help Shield You from Inflation

How Homeownership Can Help Shield You from Inflation | MyKCM

If you’re following along with the news today, you’ve likely heard about rising inflation. You’re also likely feeling the impact in your day-to-day life as prices go up for gas, groceries, and more. These rising consumer costs can put a pinch on your wallet and make you re-evaluate any big purchases you have planned to ensure they’re still worthwhile.

If you’ve been thinking about purchasing a home this year, you’re probably wondering if you should continue down that path or if it makes more sense to wait. While the answer depends on your situation, here’s how homeownership can help you combat the rising costs that come with inflation.

Homeownership Offers Stability and Security

Investopedia explains that during a period of high inflation, prices rise across the board. That’s true for things like food, entertainment, and other goods and services, even housing. Both rental prices and home prices are on the rise. So, as a buyer, how can you protect yourself from increasing costs? The answer lies in homeownership.

Buying a home allows you to stabilize what’s typically your biggest monthly expense: your housing cost. If you get a fixed-rate mortgage on your home, you lock in your monthly payment for the duration of your loan, often 15 to 30 years. James Royal, Senior Wealth Management Reporter at Bankrate, says:

A fixed-rate mortgage allows you to maintain the biggest portion of housing expenses at the same payment. Sure, property taxes will rise and other expenses may creep up, but your monthly housing payment remains the same.” 

So even if other prices rise, your housing payment will be a reliable amount that can help keep your budget in check. If you rent, you don’t have that same benefit, and you won’t be protected from rising housing costs.

Use Home Price Appreciation to Your Benefit

While it’s true rising mortgage rates and home prices mean buying a house today costs more than it did a year ago, you still have an opportunity to set yourself up for a long-term win. Buying now lets you lock in at today’s rates and prices before both climb higher.

In inflationary times, it’s especially important to invest your money in an asset that traditionally holds or grows in value. The graph below shows how home price appreciation outperformed inflation in most decades going all the way back to the seventies – making homeownership a historically strong hedge against inflation (see graph below):

How Homeownership Can Help Shield You from Inflation | MyKCM

So, what does that mean for you? Today, experts say home prices will only go up from here thanks to the ongoing imbalance in supply and demand. Once you buy a house, any home price appreciation that does occur will be good for your equity and your net worth. And since homes are typically assets that grow in value (even in inflationary times), you have peace of mind that history shows your investment is a strong one.

Bottom Line

If you’re ready to buy a home, it may make sense to move forward with your plans despite rising inflation. If you want expert advice on your specific situation and how to time your purchase, let’s connect.


Myths About Today’s Housing Market

Myths About Today’s Housing Market [INFOGRAPHIC] | MyKCM

Some Highlights

  • If you’re planning to buy or sell a home today, it’s important to be aware of common misconceptions.
  • Whether it’s timing your purchase as a buyer based on home prices and mortgage rates or knowing what to upgrade or repair before listing your house as a seller, it takes a professional to guide you through those decisions.
  • Let’s connect so you have an expert to help separate fact from fiction in today’s housing market.

The Future of Home Price Appreciation and What It Means for You

The Future of Home Price Appreciation and What It Means for You | MyKCM

Many consumers are wondering what will happen with home values over the next few years. Some are concerned that the recent run-up in home prices will lead to a situation similar to the housing crash 15 years ago.

However, experts say the market is totally different today. For example, Odeta Kushi, Deputy Chief Economist at First American, tweeted just last week on this issue:

“. . . We do need price appreciation to slow today (it’s not sustainable over the long run) but high price growth today is supported by fundamentals- short supply, lower rates & demographic demand. And we are in a much different & safer space: better credit quality, low DTI [Debt-To-Income] & tons of equity. Hence, a crash in prices is very unlikely.”

Price appreciation will slow from the double-digit levels the market has seen over the last two years. However, experts believe home values will not depreciate (where a home would lose value).

To this point, Pulsenomics just released the latest Home Price Expectation Survey – a survey of a national panel of over 100 economists, real estate experts, and investment and market strategists. It forecasts home prices will continue appreciating over the next five years. Below are the expected year-over-year rates of home price appreciation based on the average of all 100+ projections:

  • 2022: 9%
  • 2023: 4.74%
  • 2024: 3.67%
  • 2025: 3.41%
  • 2026: 3.57%

Those responding to the survey believe home price appreciation will still be relatively high this year (though half of what it was last year), and then return to more normal levels over the next four years.

What Does This Mean for You as a Buyer?

With a limited supply of homes available for sale and both prices and mortgage rates increasing, it can be a challenging market to navigate as a buyer. But buying a home sooner rather than later does have its benefits. If you wait to buy, you’ll pay more in the future. However, if you buy now, you’ll actually be in the position to make future price increases work for you. Once you buy, those rising home prices will help you build your home’s value, and by extension, your own household wealth through home equity.

As an example, let’s assume you purchased a $360,000 home in January of this year (the median price according to the National Association of Realtors rounded up to the nearest $10K). If you factor in the forecast for appreciation from the Home Price Expectation Survey, you could accumulate over $96,000 in household wealth over the next five years (see graph below):

The Future of Home Price Appreciation and What It Means for You | MyKCM

Bottom Line

If you’re trying to decide whether to buy now or wait, the key is knowing what’s expected to happen with home prices. Experts say prices will continue to climb in the years ahead, just at a slower pace. So, if you’re ready to buy, doing so now may be your best bet for your wallet. It’ll also give you the chance to use the future home price appreciation to build your own net worth through rising equity. If you want to get started, let’s connect today.


NAR Report Shows Share of Millennial Home Buyers Continues to Rise

March 23, 2022

Key Highlights:

  • Millennials now make up 43% of home buyers – the most of any generation – an increase from 37% last year.
  • Generation X bought the most expensive homes at a median price of $320,000.
  • The largest share of buyers purchased in suburban areas and small towns.
  • Eighty-seven percent of all buyers purchased their home through an agent. 

WASHINGTON (March 23, 2022) – The share of millennial home buyers increased significantly over the past year. They are also the most likely generation to use the internet to find the home they ultimately purchase and most likely to use a real estate agent.

This is according to the latest study from the National Association of Realtors®, the 2022 Home Buyer and Seller Generational Trends report, which examines the similarities and differences of recent home buyers and sellers across generations.1 The NAR report found that the combined share of younger millennial (23 to 31 years old) and older millennial buyers (32 to 41 years old) rose to 43% in 2021, up from 37% the year prior. Almost two out of three younger millennials – 65% – found the home they ultimately purchased on the internet, a number that gradually decreases with older generations. Eighty-seven percent of all buyers purchased their home through an agent. This number was highest with younger millennials (92%) and older millennials (88%).

“Some young adults have used the pandemic to their financial advantage by paying down debt and cutting the cost of rent by moving in with family. They are now jumping headfirst into homeownership,” said Jessica Lautz, NAR’s vice president of demographics and behavioral insights. “While young buyers use new tech tools, they also use real estate agents at higher rates than other buyers to help find the right home and negotiate the terms of the transaction.”

Buyers from all generations agreed about the top reasons for using an agent: they wanted help finding the right home to purchase, negotiating the terms of sale and negotiating the price. The silent generation – those between the ages of 76 and 96 – as well as younger millennials were also more likely to want their agent to help with paperwork.

Those between the ages of 42 and 56 – Generation X – had the highest median household income at $125,000. They bought the most expensive and second-largest homes at a median price of $320,000 and size of 2,300 square feet, respectively. Older millennials purchased the largest homes at 2,400 square feet, and the silent generation bought the smallest at 1,800 square feet. Across all generations, the largest share of buyers purchased in suburban areas (51%) and small towns (20%).

“Not surprisingly, younger generations typically upgraded in size and price while older generations purchased more affordable properties,” Lautz said. “The majority of all generations bought single-family homes at higher shares than other housing types, and younger buyers dispelled the myth that they are flocking to city centers. When it comes to location, the suburbs and small towns are the places to buy.”

Three out of five of recent buyers – 60% – were married couples, 19% were single females, 9% were single males and 9% were unmarried couples. The highest share of unmarried couples were younger millennials at 21%. Single-female buyers significantly outnumbered single-male buyers across all generations. The highest percentage of single-female buyers was in the silent generation at 27%.

The study also found that first-time home buying among younger generations is on the rise, with over 4 out of 5 younger millennial home buyers – 81% – purchasing for the first time. Just under half – 48% – of older millennial buyers were first-time buyers.

“While the pandemic allowed many potential buyers to save for a down payment, demographics played a key role,” Lautz said. “There is a wave of millennial buyers who are aging into the traditional first-time buyer age range.” Boomers made up the largest share of home sellers at 42%, although the percentage of millennial sellers is on the rise, increasing from 22% to 26% over the past year. Lautz noted that for the first time it is now more likely for an older millennial to be a first-time seller than a first-time buyer.

“Many factors can contribute to the decision to buy or sell a home,” Lautz continued. “For all home buyers under the age of 57, the main driver was the desire to own a home of their own. Among those 57 and older, the desire to be closer to friends and family was the top reason, followed by the desire for a smaller home.”

Younger generations tended to move shorter distances when relocating. Among all ages, there was a median of 15 miles from the homes where recent buyers previously resided and the homes that they purchased. That distance was lowest among younger millennials (10 miles) and highest among older boomers (35 miles).

Overall, buyers expected to live in their homes for 12 years, down from 15 years last year. For younger millennials and the silent generation, the expected duration was only 10 years, compared to 20 years for younger boomers.

Debt continues to be a significant barrier for many when attempting to buy a home. Both Generation X and younger boomers delayed purchasing a home for five years due to debt, the longest of all age groups. Younger millennials had the highest share of student debt at 45%, with a median amount of $28,000. Twenty-seven percent of younger millennials cited that saving for a down payment was the most challenging step in the home buying process, compared to just 1% for older boomers. Nearly one in three – 29% – of younger millennials received down payment help in the form of a gift or loan from a friend or relative and 24% lived with friends or family, directly saving on rental costs.

Despite this hurdle, a vast majority of buyers have a positive outlook on homeownership. Eighty-six percent of all buyers reported they viewed a home purchase as a good investment, and roughly nine out of 10 people – 89% – said that they would recommend their agent for future services.

“A truth across all generations is that homeownership is seen as a cornerstone of the American dream,” said NAR President Leslie Rouda Smith, a Realtor® from Plano, Texas, and a broker associate at Dave Perry-Miller Real Estate in Dallas. “From building personal wealth and fostering communities, to strengthening social stability and driving the national economy, the value of homeownership is indisputable. Home buyers continue to turn to Realtors® as a trusted resource for helping find the right home and successfully navigating this increasingly complex process.”

The National Association of Realtors® is America’s largest trade association, representing more than 1.5 million members involved in all aspects of the residential and commercial real estate industries.

# # #1 Survey generational breakdowns: Generation Z: (ages 18-22); younger Generation Y/millennials (ages 23-31); older Generation Y/millennials (ages 32-41); Generation X (ages 42-56); younger boomers (ages 57-66); older boomers (ages 67-75); and the silent generation (ages 76-96).


NAR: Feb. Existing-Home Sales Drop 7.2%

By Kerry Smith

Year-to-year, sales declined 2.4%. NAR’s chief economist calls it a “double whammy” for buyers who face rising mortgage rates and sustained price increases.

WASHINGTON – U.S. existing-home sales dipped in February, continuing a seesawing pattern of gains and declines over the last few months, according to the National Association of Realtors® (NAR).

Each of the four major U.S. regions tracked in NAR’s monthly survey saw sales fall on a month-over-month basis. While sales activity year-over-year was also down overall, the South – the region that includes Florida – saw an increase while the remaining three regions reported drops.

Total existing-home sales – completed transactions that include single-family homes, townhomes, condominiums and co-ops – sank 7.2% from January to a seasonally adjusted annual rate of 6.02 million in February. Year-over-year, sales decreased 2.4% (6.17 million in February 2021).

“Housing affordability continues to be a major challenge as buyers are getting a double whammy: rising mortgage rates and sustained price increases,” says Lawrence Yun, NAR’s chief economist. “Some who had previously qualified at a 3% mortgage rate are no longer able to buy at the 4% rate.

“Monthly payments have risen by 28% from one year ago – which interestingly is not a part of the consumer price index – and the market remains swift with multiple offers still being recorded on most properties.”

Total housing inventory at the end of February totaled 870,000 units, up 2.4% from January and down 15.5% from one year ago (1.03 million). Unsold inventory sits at a 1.7-month supply at the current sales pace, up from the record-low supply in January of 1.6 months, but down from 2.0 months in February 2021.

“The sharp jump in mortgage rates and increasing inflation is taking a heavy toll on consumers’ savings,” Yun says. “However, I expect the pace of price appreciation to slow as demand cools and as supply improves somewhat due to more home construction.”

The median existing-home price for all housing types in February was $357,300, up 15.0% from February 2021 ($310,600), with prices higher in all four regions. It’s the 120th consecutive months for year-over-year increases – the longest-running streak on record.

Properties typically remained on the market for 18 days in February, down from 19 days in January and 20 days in February 2021, with 84% of February homes on the market for less than a month.

First-time buyers made up 29% of February sales, an increase from 27% in January, though down from 31% in February 2021.

Individual investors or second-home buyers, who make up many cash sales, purchased 19% of homes in February, down from 22% in January and up from 17% in February 2021. All-cash sales accounted for 25% of transactions in February, down from 27% in January and up from 22% in February 2021.

Distressed sales – foreclosures and short sales – represented less than 1% of sales in February, equal to the percentage seen both month-to-month and year-to-year.

According to Freddie Mac, the average commitment rate for a 30-year, conventional, fixed-rate mortgage was 3.76% in February, up from 3.45% in January. The average commitment rate across all of 2021 was 2.96%.

Single-family and condo/co-op sales: Single-family home sales jumped to a seasonally adjusted annual rate of 5.35 million in February, down 7.0% month-to-month and down 2.2% year-to-year. The median existing single-family home price was $363,800 in February, up 15.5% from February 2021.

Existing condominium and co-op sales were recorded at a seasonally adjusted annual rate of 670,000 units in February, down 9.5% from 740,000 in January and down 4.3% from one year ago. The median existing condo price was $305,400 in February, an annual increase of 10.9%.

“For the past couple of years, buyers have had to contend with a market of high demand, low inventory and a mix of uncertainties with COVID-19 protocols,” says NAR President Leslie Rouda Smith. “Consumers are presently challenged with higher mortgage rates, so now, more than ever, interested buyers need the trusted expertise of Realtors in order to navigate this current market.”

Regional breakdown: Existing-home sales in the Northeast slipped 11.5% in February, registering an annual rate of 690,000 – a 12.7% drop from February 2021. The median price in the Northeast was $383,700, up 7.1% from one year ago.

Existing-home sales in the Midwest sagged 11.3% from the prior month to an annual rate of 1,330,000 in February, a 1.5% decrease from February 2021. The median price in the Midwest was $248,900, a 7.5% climb from February 2021.

Existing-home sales in the South fell 5.1% in February month-to-month, posting an annual rate of 2,790,000 – which was an increase of 3.0% compared to February 2021. The median price in the South was $318,800, an 18.1% jump from one year earlier.

For the sixth straight month, the South experienced the highest pace of price appreciation compared to the other regions.

“Employment is vital for housing demand,” said Yun. “The Southern states are seeing faster job growth, and consequently, it’s the only region to experience a sales gain from a year ago.”

Existing-home sales in the West slid 4.7% from the previous month, reporting an annual rate of 1,210,000 in February, down 8.3% from one year ago. The median price in the West was $512,600, up 7.1% from February 2021.


Fed Fights Inflation: Boosts Interest Rates 1/4 Point

By Christopher Rugaber

The expected interest-rate increase will raise short-term borrowing costs for things like credit cards, and it often has an indirect impact on mortgage rates.

WASHINGTON (AP) – The Federal Reserve launched a high-risk effort Wednesday to tame the worst inflation since the 1970s, raising its benchmark short-term interest rate and signaling potentially up to seven rate hikes this year.

The Fed’s quarter-point hike in its key rate, which it had pinned near zero since the pandemic recession struck two years ago, marks the start of its effort to curb the high inflation that has followed the recovery from the recession. The rate hikes will eventually mean higher loan rates for many consumers and businesses.

The central bank’s policymakers expect inflation to remain elevated and to end 2022 at 4.3%, according to updated quarterly projections they released Wednesday. That’s far above the Fed’s 2% annual target. The officials also now forecast much slower economic growth this year: 2.8%, down from its 4% estimate in December.

Chair Jerome Powell is steering the Fed into a sharp U-turn. Officials had kept rates ultra-low to support growth and hiring during the recession and its aftermath. As recently as December, Fed officials had expected to raise rates just three times this year. Now, its projected seven hikes would raise its short-term rate to 1.875% at the end of 2022. It could increase rates by a half-point at future meetings.

Fed officials also forecast four additional hikes in 2023, boosting its benchmark rate to 2.8%. That would be the highest level since March 2008. Borrowing costs for mortgage loans, credit cards and auto loans will likely rise as a result.

Powell is hoping that the rate hikes will achieve a difficult and narrow objective: Raising borrowing costs enough to slow growth and tame high inflation, yet not so much as to topple the economy into recession.

Yet many economists worry that with inflation already so high – it reached 7.9% in February, the worst in four decades – and with Russia’s invasion of Ukraine driving up gas prices, the Fed may have to raise rates even higher than it now expects and potentially tip the economy into recession.

By its own admission, the central bank underestimated the breadth and persistence of high inflation after the pandemic struck. Many economists say the Fed made its task riskier by waiting too long to begin raising rates.

Since its last meeting in January, the challenges and uncertainties for the Fed have escalated. Russia’s invasion has magnified the cost of oil, gas, wheat and other commodities. China has closed ports and factories again to try to contain a new outbreak of COVID, which will worsen supply chain disruptions and likely further fuel price pressures.

In the meantime, the sharp rise in average gas prices since the invasion, up more than 60 cents to $4.31 a gallon nationally, will send inflation higher while also probably slowing growth – two conflicting trends that are notoriously difficult for the Fed to manage simultaneously.

The economy’s steady expansion does provide some cushion against higher rates and more expensive gas. Consumers are spending at a healthy pace, and employers keep rapidly hiring. There are still a near-record 11.3 million job openings, far outnumbering the number of unemployed.

Copyright 2022 The Associated Press. All rights reserved. This material may not be published, broadcast, rewritten or redistributed without permission.


The Federal Reserve Is Ready To Raise Interest Rates Soon Despite The War In Ukraine

SCOTT HORSLEY Twitter LISTEN· 4:10
Heard on All Things Considered

Federal Reserve Chair Jerome Powell testifies about monetary policy and the state of the economy before the House Financial Services Committee on Wednesday. Powell reiterated the Fed is gearing up to raise interest rates this month.

Federal Reserve Chair Jerome Powell said on Wednesday the central bank is on track to start raising interest rates this month — likely by a quarter percentage point — in an effort to combat inflation, which is the highest it’s been in nearly 40 years.

But the Fed will proceed with caution, Powell told the House Financial Services Committee, as Russia’s invasion of Ukraine adds more uncertainty to the economic outlook.

“The economics of these events are highly uncertain,” Powell said. “So far, we’ve seen energy prices move up further and those increases will move through the economy and push up headline inflation, and also they’re going to weigh on spending.”

The average price of gasoline in the U.S. approached $3.66 per gallon on Wednesday. Rising energy prices have been a significant driver of annual inflation, which hit 7.5% in January – the highest level since 1982.

Powell says it’s too soon to tell on Ukraine

Powell said it’s too soon to know how large or long-lasting price increases tied to events in Ukraine will be, so he and his colleagues on the central bank’s rate-setting committee are prepared to be flexible.

“We’re never on auto-pilot,” Powell said. “Those of us on the committee have an expectation that inflation will peak and begin to come down this year. And to the extent that inflation comes in higher or is more persistently high than that, then we would be prepared move more aggressively.”

Forecasters expect the Fed to impose additional interest rate hikes later this year in an effort to cool red-hot consumer demand, which has outstripped supply and driven prices sharply higher.


read the NPR full article